The Value of Income Surveys
Access to funding has been, and continues to be, a central thread in how the Rural Community Assistance Partnership (RCAP) increases a community’s technical, managerial, and financial capacity. How access to funding happens comes from potentially numerous different possibilities and hurdles for technical assistance (TA) providers like RCAP. From collaborating with a community on an Emergency Response Plan (ERP), providing a rate assessment, or building a service line inventory, these all help toward building capacity and help with funding program requisites. RCAP provides diverse types of services through federal grants and prioritizes the needs of the community to fit the best financial outcome that also satisfies public health and environmental protection. For small and rural communities, the approach to funding often comes with a desire for loan subsidies or grant resources. When addressing loan/grant scenarios, one of the best services RCAP provides are community characteristic surveys, specifically income surveys. These surveys supply a snapshot that highlights the data needed to identify and figure out funding programs that meet a community’s needs.
Community characteristic data immensely helps to show and express a narrative that opens opportunity for a community. Using available census data supplies useful information but may not capture or be representative of a community. This is the case for many small and rural communities where eligibility criteria, like the Median Household Income (MHI), may not be available or accurate. MHI is used by many community funding houses as a primary financial identifier for grant/subsidy allotment. The MHI is calculated from an income survey of a community or a Universe. Universe is used to refer to the pool of households that are being surveyed. Different community sizes and project details will vary the amount in a Universe from survey to survey. but each survey must have a goal for completed surveys. The goal is the minimum number of completed surveys to ensure the calculated results are representative and accurate. Even working through various funding houses, RCAP can step in and provide trusted third-party income surveys for communities in need of characteristic data and reports.
There are useful assessments using the income survey data. Calculating the MHI from an income survey gives us two things: one, a baseline to work with and; two, the ability to compare the data with other known data. For example, calculating a community’s affordability index uses MHI and the average annual customer fee. The affordability index, or ratio, is a great way to assess if there is potential distress for the customers. The average annual customer bill can be the current average customer fee, or a predicted amount could be used. Using a predicted amount can help especially working through debt service increases like a capital improvement loan that will lead to rate increases. The affordability index that compares MHI to average fee works out to be a percentage. This percentage is the part of annual income that is used for the utility bill. The funding house may have different values and thresholds for affordability. For example, a community with an MHI of $55,000 per year and has a water bill that will equal $1,000 per year to fund required lead line replacement may be eligible for subsidies under the affordability criteria with the funder, if a threshold of 1.5% is set. In this same way a community can also use the affordability index to measure fairness and potential distress when considering the long-term impact of projects costs and dealing with necessary rate increases. Taking this step can provide the customers with a level of trust and care. Ensuring communities can be resilient to project costs by looking at the income data is significant to financial capacity. RCAP is grateful to provide TA with its broad base of knowledge and resources to support the future of these communities.
Looking at just a few aspects that use income survey data, like eligibility, affordability index, and measuring fairness, shows the potential value of an income survey to a community. Each community has unique characteristics, helping to identify the characteristics is a major step in getting access to funds. RCAP continues to build ways to help communities with financial needs. Fiscal viability is tied into revenue streams that come from the customers on the utility. When looking at the impact of project costs on a community, RCAP provides the services to open opportunity and increase capacity. The value of income surveys can truly bridge a connection between a capital improvement project and the funds required to make it happen.
This article is funded by EPA under RCAP’s EPA EFC 23 – 27, Cat 3 grant.

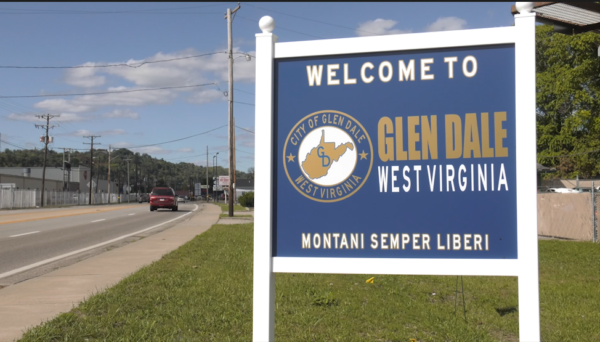
The Story of Glen Dale, West Virginia | RCAP Narrative
Per- and Polyfluorniated substances (PFAS) are man-made chemicals used for decades to make non-stick and water-resistant consumer products. Exposure to PFAS through drinking water is a global health concern. In 2021, the city of Glen Dale, West Virginia identified PFAS in their drinking water.
See how this city is battling PFAS contaminants and what their plan is on tackling this issue.

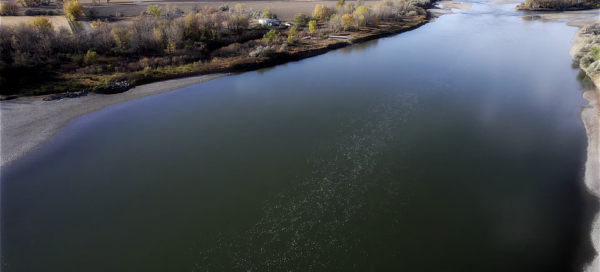
The Story of Hysham, Montana | RCAP Narrative
Hysham is a small community of 276 people on the Yellowstone River in eastern Montana. The town has struggled to keep a certified operator and was on a Do-Not-Consume order for more than a year due to the buildup of Manganese in the transmission mains and treatment plant piping. The treatment plant and transmission piping are quite old and need replacement. The Town is pursuing emerging contaminant funding through the SRF program to replace the transmission mains and piping with excess manganese buildup. The town is 53% low to moderate income and is considered disadvantaged by USDA under the Climate Change, Energy, Health, and Legacy Pollution categories. Hysham is in the 90th percentile for heart disease and the 95th percentile for cancer rates. As far as climate change is concerned, Hysham is in the 80-90th percentile for both flood and wildfire risk.
Watch their story and see how the Midwest Assistance Program (MAP) assisted them in getting off the Do-Not-Consume order.