Streamlining Operations: GIS as the One-Stop Shop for Small Water Utilities
Water utilities are constantly juggling the management of their physical and digital infrastructure. With a myriad of assets ranging from pump stations and storage tanks to valves, hydrants, and pipes, proactive management of these assets can seem insurmountable for operators, particularly those overseeing small to medium-sized systems with limited resources. For staff managing these utilities alone or with minimal assistance, keeping track of numerous assets can feel overwhelming, especially without access to a robust asset management software that offers features such as smart data entry, analytics, and customization.
Recognizing the need for a comprehensive solution at an affordable price, many water operators in small utility systems are turning to Geographic Information Systems (GIS). GIS enables operators to pinpoint assets using GPS coordinates and photos, and facilitates streamlined recording of operation, maintenance, and inspection records. This data can be easily accessed and analyzed through a real-time asset management dashboard. GIS therefore emerges as an indispensable “one-stop shop” for small water utilities, addressing their needs for accurate asset location, asset management, and operational efficiency. Small water systems typically rely on multiple software applications for efficient day-to-day operations of water treatment and distribution. Navigating through these various applications can be challenging for operators, particularly when managing other essential maintenance tasks. For instance, a water system may utilize computerized maintenance management system (CMMS) software for meter billing and customer data management, supervisory control and data acquisition (SCADA) systems for monitoring treatment-related assets such as tank levels, chemical levels, and pump performances, as well as software for leak detection or material identification. Given this complexity, it becomes crucial to consolidate distribution-related recordkeeping and asset locating using GIS as a primary software system. This eliminates the need for multiple individual software applications for each specific use, streamlining operations and enhancing efficiency.
GIS can handle complex calculations, such as logging critical data during hydrant flushing operations, estimating the water loss during a main break, or recording historical data in a valve exercising program. Moreover, GIS enables visualization and analysis of data from these operations and maintenance activities through various web mapping applications and dashboards. This capability empowers operators to make informed decisions and optimize their system’s performance. Another significant benefit of GIS is its capability to serve as a central repository for various existing data sources. Whether it is as-built engineer records, curb stop tie cards, asset management records, scanned work orders, or other pertinent information, GIS can consolidate this information into one unified location known as a geodatabase. This geodatabase can then be integrated into online web-based GIS layers, offering a digital representation of each asset on the map. These layers include tabular descriptions, tables, attachments, and photos, providing a comprehensive and easily accessible database for efficient data management. The versatility of GIS software makes it ideal for small water systems, eliminating the need to purchase separate software for each individual operations and maintenance task. GIS can be recognized as the “last stop” in a water operator’s journey to managing their physical and digital infrastructures
This article was funded under RCAP’s EPA NPA 1 23 – 25 grant.

Breakpoint Chlorination: What is it? Why is it so important?
How many operators truly understand breakpoint chlorination? Both new and experienced operators continue to face challenges in comprehending its significance and determining whether their system has achieved an adequate residual level. Breakpoint chlorination is not simply about attaining an arbitrary free chlorine concentration. It is, in fact, defined as “the point at which enough chlorine has been added to a quantity of water to satisfy its disinfecting demand” (Breakpoint Chlorination).
While newer operators are still familiarizing themselves with the concept of breakpoint chlorination, even seasoned professionals often find it difficult to fully grasp its implications. Furthermore, how can operators be certain that their system has reached an adequate residual level? This question warrants further consideration. To clarify, breakpoint chlorination is not about reaching a random free chlorine value but about ensuring the system is properly disinfected and the required demand has been met.
Stage 1: Chlorine Demand
In this stage, chlorine is first introduced to water where it will react with reducing agents like hydrogen sulfide, iron, and manganese. During this stage, all the chlorine is consumed by the reducing agents which will result in no free chlorine residual. This is known as “Zone 1” of the breakpoint chlorination curve.
Stage 2: Formation of Chlororganics and Chloramines
It is well documented that ammonia is present in water. Because of that, as chlorine is increased, it will begin to react with ammonia to produce monochloramine, dichloramine, and trichloramine. Many communities disinfect with chloramines because chloramines maintain a residual longer in a long distribution system. The major drawback with chloramines includes taste and odor issues as well as they are a less effective disinfectant. This is known as “Zone 2” of the breakpoint chlorination curve.
Stage 3: Destruction of Chlororganics and Chloramines to Breakpoint
Here is where all the chlororganic and chloramine compounds that have been formed begin to break down with the addition of more chlorine. It is here where customers will complain that there is too much chlorine in the water. It is also here that when these complaints come in, the chlorine feed does not get decreased but rather increased instead. That is right, that just doesn’t seem to make any sense whatsoever. Once the compounds are destroyed, the breakpoint curve will drop. Any residual at this point will be total chlorine. This is known as “Zone 3” of the breakpoint chlorination curve.
Stage 4: Free Chlorine Residual
Here in “Zone 4”, the addition of chlorine will be strictly free, available chlorine that is highly effective for disinfection. In this zone, the residual chlorine is present to ensure ongoing protection against recontamination as the water travels throughout the distribution system.
At the beginning of this article, we stated that many operators are unsure whether their system has reached an adequate residual level. In order to determine whether said system has reached the adequate residual level, collect your instantaneous sample and divide it in half. One of the samples will be tested for total chlorine, while the other needs to be tested for free chlorine. Once you obtain your residual results, take the free chlorine and divide it by total chlorine then multiply it by 100. If your result is greater than 75% then you have an acceptable chlorine residual level. Although 75% is an acceptable result, your best result will be 80% or greater.
Free Chlorine ÷ Total Chlorine × 100 = Percent
This article was funded under RCAP’s EPA NPA 1 23 – 25 grant.

Saving Our Most Valuable Asset with Safety Training
According to the US Bureau of Labor Statistics, in 2022, for every 100 employees in the water, sewage, and other systems-related industries, 5.4 employees sustained injuries. Of those injured, 2.8 out of every 100 employees were injured severely enough to result in missed work, job transfers, or restricted duties (http://bls.gov/web/osh/table-1-industry-rates-national.html). These statistics highlight a clear need for employees to know the potential hazards they may be exposed to and how to protect themselves.
Water and wastewater treatment employees face various risks and hazards daily, and addressing these risks is vital to ensure the well-being of both employees and citizens of the communities they serve. Safety training is the attempt to inform employees of how to prevent and respond to work-related illness and injury. Safety training can be provided in different formats, such as on-the-job safety equipment training, classroom seminars, online training, and/or videos. Good safety training will inform employees of potential danger on the job and will teach and encourage safe work habits.
Safety training should be designed to fit the needs of the target audience. Rather than having a standard form of safety training, start with a few fundamentals, and then deal with specific risks to the particular employee. With this in mind, training can include some of the following:
Proper use of equipment: Train employees on the correct use of any equipment they will be using. Follow that up with a quick observation of the employees using the equipment themselves to ensure comprehension.
Appropriate storage and equipment and materials: The third leading cause of injury is bodily reactions such as slipping and tripping. A large percentage of these accidents can be avoided by simply keeping walkways clear and work areas clean.
Handling of hazardous material: Employees should be trained in how to be confident and careful with such materials.
Reporting procedures: When employees notice an unsafe area or situation on the job, it is important that they know how to report it and have it corrected.
Responding to injuries on the job: It is inevitable that some injuries will happen on the job. How should employees respond when they or someone else is injured on the job? To whom should they report the injury? If employees need basic first aid skills, include a first aid class as part of the training.
Working alone: It may not always be possible to send people out in pairs, depending on staffing numbers and the needs of various jobs. This is where Lone Worker Safety Programs provide individuals with the support needed to complete jobs safely. It can be as simple as implementing a check-in schedule to encourage communication between employees and/or supervisors.
There is no end to the possible topics of safety training. One common practice is to record injuries that have occurred at your workplace in the past year or two and tailor safety training to address those specific issues.
Not only do you need to record injuries, but you also need to record all training that has been conducted during the year. Review your safety training program annually to gauge your current safety practices, to assess their effectiveness and to identify any other risks that they have yet to address.
Safety is a number one priority, and maintaining a zero -accident record should be everyone’s goal.
This article was funded under RCAP’s USDA Technitrain 23 – 25 grant.

Line Installation: How to Avoid Future Nightmares
Many small systems find themselves in dire straits during extreme weather events due to improper installation of waterlines during the original construction of the system. These issues often become apparent during events such as droughts, high temperatures, or sub-freezing conditions. In these scenarios, the costs of repairs can be substantial, and affected customers may experience low water pressure or complete service interruptions, leading to diminished customer confidence in the system.
How can these issues be avoided?
Ensure your project engineer stays engaged with the system during construction and makes frequent unscheduled visits.
Hire a qualified project inspector who can interpret the plans and specifications and is confident enough to enforce them. Interview prospective inspectors and have them go through the plans and specifications and demonstrate their ability to understand the requirements.
Call in the project engineer if needed to give clarification and directions to the contractor. If project inspection is provided by the engineering firm, make sure the inspector is always present during line installation or require the contractor to leave the trench open until it is inspected.
Require the project inspector to keep a daily diary to include weather and ground conditions, the number of crew members on site each day, the amount of pipe installed each day, notes as to any issues that arise each day, notes regarding any materials delivered, and whether these meet the specifications. This daily diary will be of value when change orders are requested for extra contract days, and if there are any questions as to the quantities of line installed for the monthly pay estimate.
Schedule regular monthly construction progress meetings to discuss work performed, quantity and quality of work, time schedules, pay estimates, and change orders. If issues are noted during inspections, this is the time to review the plans and specifications and make sure everyone understands what is expected and what will be accepted.
Require the contractor to make change order requests as changes are needed, and monthly for any requests for a time extension based on weather conditions. Discussing these during the monthly progress meeting can help everyone come to an agreement and help appropriately manage the contingency fund.
Have someone from the system, such as a board member or operator, take an active role in checking in with the inspector and seeing what work is being done. This person can’t give directions to the contractor but can report to the governing body and project engineer if there are issues noted. This person should attend the monthly progress meeting and if the issues they noticed are not discussed by the project inspector during the meeting, bring this to the engineer’s attention.
Take pictures or videos. This cannot be stressed enough. If you have pictures of work in progress, you have documentation if the contractor is not meeting the requirements of the contract. Pictures are worth a thousand words.
In ensuring proper line installation, vigilance and proactive measures are key. By implementing stringent inspection protocols, fostering clear communication channels and maintaining meticulous documentation, small systems can safeguard against future nightmares, ensuring reliable water service and maintaining customer trust, even in the face of extreme weather events.
This article was funded under RCAP’s USDA Technitrain 23 – 24 grant.

RCAP CEO Olga Morales-Pate Interviews with Municipal Water Leader
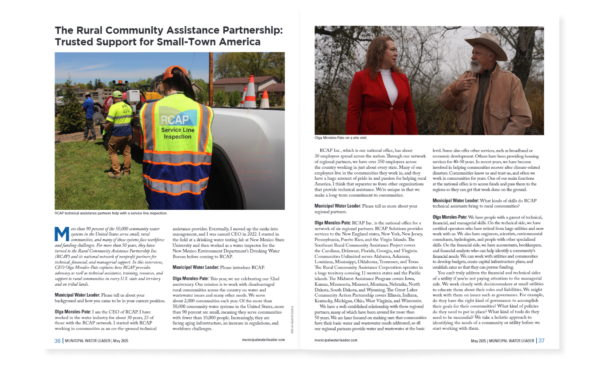
Municipal Water Leader Magazine recently published an article highlighting RCAP CEO Olga Morales-Pate. The interview’s focus spans across the work RCAP does. As a network of six regional partners that operate across the nation, the needs and challenges of each rural community can vary greatly. What ties this work together, however, are the dedicated staff, partners, and community members who are committed to tackling the obstacles in front of them. “… rural areas have a lot of basic infrastructure needs,” Morales-Pate states. “We need to invest in an intentional way to make those communities resilient, which will benefit the entire country. That is the vision we work for each day, and we do everything we can to make it a reality.”
Click here to read the full article.

The Story of Glen Dale, West Virginia | RCAP Narrative
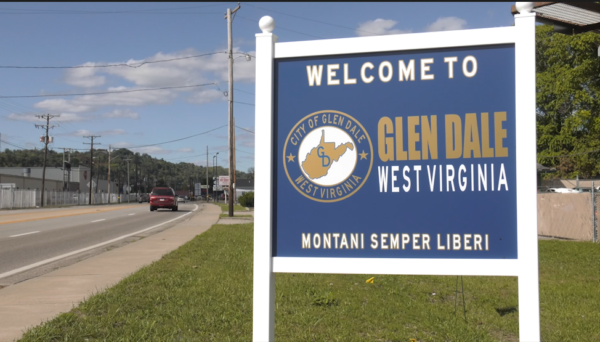
Per- and Polyfluorniated substances (PFAS) are man-made chemicals used for decades to make non-stick and water-resistant consumer products. Exposure to PFAS through drinking water is a global health concern. In 2021, the city of Glen Dale, West Virginia identified PFAS in their drinking water.
See how this city is battling PFAS contaminants and what their plan is on tackling this issue.

The Story of Hysham, Montana | RCAP Narrative
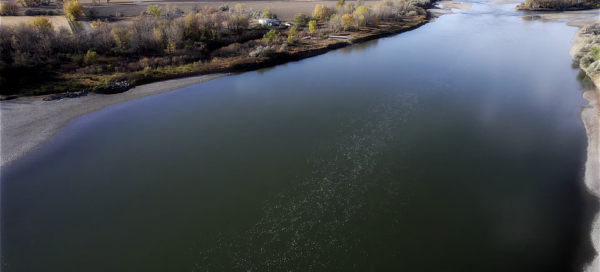
Hysham is a small community of 276 people on the Yellowstone River in eastern Montana. The town has struggled to keep a certified operator and was on a Do-Not-Consume order for more than a year due to the buildup of Manganese in the transmission mains and treatment plant piping. The treatment plant and transmission piping are quite old and need replacement. The Town is pursuing emerging contaminant funding through the SRF program to replace the transmission mains and piping with excess manganese buildup. The town is 53% low to moderate income and is considered disadvantaged by USDA under the Climate Change, Energy, Health, and Legacy Pollution categories. Hysham is in the 90th percentile for heart disease and the 95th percentile for cancer rates. As far as climate change is concerned, Hysham is in the 80-90th percentile for both flood and wildfire risk.
Watch their story and see how the Midwest Assistance Program (MAP) assisted them in getting off the Do-Not-Consume order.

Streamlining Operations: GIS as the One-Stop Shop for Small Water Utilities
Water utilities are constantly juggling the management of their physical and digital infrastructure. With a myriad of assets ranging from pump stations and storage tanks to valves, hydrants, and pipes, proactive management of these assets can seem insurmountable for operators, particularly those overseeing small to medium-sized systems with limited resources. For staff managing these utilities alone or with minimal assistance, keeping track of numerous assets can feel overwhelming, especially without access to a robust asset management software that offers features such as smart data entry, analytics, and customization.
Recognizing the need for a comprehensive solution at an affordable price, many water operators in small utility systems are turning to Geographic Information Systems (GIS). GIS not only enables operators to pinpoint assets using GPS coordinates and photos, but also facilitates streamlined recording of operation, maintenance, and inspection records. This data can be easily accessed and analyzed through a real-time asset management dashboard. Therefore, GIS emerges as an indispensable “one-stop shop” for small water utilities, addressing their needs for accurate asset location, asset management, and operational efficiency. Small water systems typically rely on multiple software applications for efficient day-to-day operations of water treatment and distribution. Navigating through these various applications can be challenging for operators, particularly when managing other essential maintenance tasks. For instance, a water system may utilize computerized maintenance management system (CMMS) software for meter billing and customer data management, supervisory control and data acquisition (SCADA) systems for monitoring treatment-related assets such as tank levels, chemical levels, and pump performances, as well as software for leak detection or material identification. Given this complexity, it becomes crucial to consolidate distribution-related recordkeeping and asset locating using GIS as a primary software system. This eliminates the need for multiple individual software applications for each specific use, streamlining operations and enhancing efficiency.
GIS can handle complex calculations, such as logging critical data during hydrant flushing operations, estimating the water loss during a main break, or recording historical data in a valve exercising program. Moreover, GIS enables visualization and analysis of data from these operations and maintenance activities through various web mapping applications and dashboards. This capability empowers operators to make informed decisions and optimize their system’s performance. Another significant benefit of GIS is its capability to serve as a central repository for various existing data sources. Whether it is as-built engineer records, curb stop tie cards, asset management records, scanned work orders, or other pertinent information, GIS can consolidate this information into one unified location known as a geodatabase. This geodatabase can then be integrated into online web-based GIS layers, offering a digital representation of each asset on the map. These layers include tabular descriptions, tables, attachments, and photos, providing a comprehensive and easily accessible database for efficient data management. The versatility of GIS software makes it ideal for small water systems, eliminating the need to purchase separate software for each individual operations and maintenance task. GIS can be recognized as the “last stop” in a water operator’s journey to managing their physical and digital infrastructures.
This article was funded under RCAP’s EPA NPA 1 23 – 25 grant.

Challenges of a Tribal City: Eagle Butte, SD
State recognized municipalities located within Tribal boundaries can sometimes have unique challenges not seen in a typical small town. The incorporated city of Eagle Butte, South Dakota (population 1,258, of which 88% are American Indian) is the home of the Cheyenne River Sioux Tribe (CRST) Tribal headquarters and lies inside the boundaries of this Tribal nation. The CRST reservation was created in 1889 by the breakup of the Great Sioux Reservation with four of the seven Lakota bands. The reservation is located in north central South Dakota and covers almost all of Dewey and Ziebach Counties. The total land area is 4,266,987 square miles, making it the fourth largest Tribal-owned land area in the United States.
Before the CRST created their own utility, any Tribal-paid improvements made to utilities inside city limits were transferred to the city to maintain. Around 2014, the CRST created the Mni Wašté Water Company and started handling their own wastewater operations and maintenance for the Reservation. As a result, the question of ownership came into play for prior improvements and maintenance to the aging system and who was responsible for future repairs and replacements. With those unanswered questions, there was potential for conflict. For example, at one point in time, one entity hired a contractor to inspect the sewer lines with a camera, resulting in the other entity issuing a cease-and-desist order through their legal counsel. Although the video confirmed that the gravity sewer infrastructure needed repairs and replacements, which was already obvious due to the known collapsed non-working sewer lines, the situation has become contentious because there are two utilities vying for the utility revenue.
The Cheyenne River Sioux Tribe Long Term Group (CRSTLTG) contacted Midwest Assistance Program (MAP) to request their assistance in getting their Tribe and Eagle Butte back on track to make necessary improvements to their infrastructure. Initially, MAP identified possible funding to fix these issues: the State Revolving Loan Fund (SRF), the United States Department of Agriculture Rural Development (USDA-RD), and/or the Indian Health Services (IHS). However, until ownership could be determined, it was impossible to know which entity applies for and manages the funds, since only one utility can apply for and receive funds with the approval of the other entity.
The first thing MAP did was identify all the players and convened a meeting that included representatives from the city of Eagle Butte, CRST, CRSTLTG, USDA-RD, IHS, the Planning District, and the city’s engineering firm. SRF representatives had removed themselves from the discussion, recognizing that Eagle Butte could obtain more grant funds through USDA-RD, considering their Tribal status and that their median household income (MHI) was below 60% of the state’s average. Dialogue could now resume between all the parties to ensure the repairs were made to the systems.
MAP then started helping the city with the USDA-RD application, while simultaneously providing on-site training to the new finance officer. MAP drafted a letter of support from the city to the CRST, asking for their support for the improvements. If support was granted, the city would receive an additional 10% in USDA-RD grant funding, but the CRST has yet to sign the letter.
Despite these setbacks, these entities are all in dialogue to uncover solutions for their utility issues, with MAP’s assistance. As a result, the engineering firm initiated planning and worked on gathering cost estimates, while USDA-RD reopened the old applications. The CRSTLTG is grateful for MAP’s assistance and remains positive that the two entities can work out their differences for the good of their community.
“Your commitment has had a profound impact on our community, and we deeply appreciate the care and attention you’ve shown throughout this process. Your efforts have not only addressed our immediate needs but have also laid the foundation for a stronger, more resilient future for our community.” – Art Rave, Cheyenne River Sioux Tribe Long Term Group
MAP will continue to provide assistance for a long-term solution for the residents of Eagle Butte and the Cheyenne River Sioux Tribe.
This article was funded under RCAP’s EPA Treatment Works 3 – Tribal 23 – 26 grant.